4 Introduction to coordinate reference systems
In order to do geospatial analysis and to create maps, we need to make sure all of our data is using the same projected coordinate reference system. The topic of coordinate reference systems and map projections is large and can be quite complex (and fascinating). After this module you should be able to:
- Describe the difference between a geographic and projected coordinate reference systems,
- Name some common schemes for describing coordinate reference systems.
- Interpret a PROJ4 and/or WKT coordinate reference system description.
4.1 Readings and resources
4.2 Coordinate reference systems
A data structure cannot be considered geospatial unless it is accompanied by coordinate reference system (CRS) information, in a format that geospatial applications can use to display and manipulate the data correctly. CRS information connects data to the Earth’s surface using a mathematical model.
One very common CRS that you will encounter is known as EPSG:4326 (more on names later). EPSG:4326 is a geographic coordinate system and not a projected coordinate system.
A good explanation of the difference between these two things is provided by ESRI.
- A GCS defines where the data is located on the earth’s surface.
- A PCS tells the data how to draw on a flat surface, like on a paper map or a computer screen.
and
A projected coordinate system (PCS) is a GCS that has been flattened using a map projection.
The EPSG:4326 CRS uses longitude and latitude to locate points on an underlying model of the earth (WGS84). But, this is a 3D model and any attempt to represent it in 2D (via one of countless possible projections) will lead to different degrees of distortion in area, distance and angle conformance. Before plotting geographic data on some 2D surface (e.g. screen or paper) we need to pick an appropriate projected coordinate reference system.
The CRS associated with a dataset tells your mapping software (for example Python) where the data is located in geographic space. It also tells the mapping software what method should be used to flatten or project the data in geographic space.
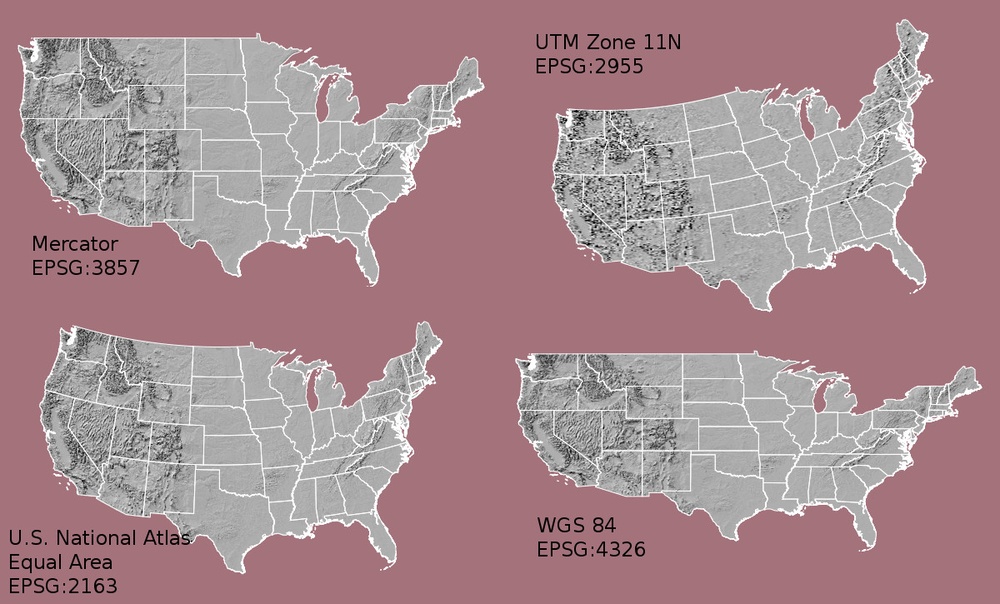
The above image shows maps of the United States in different projections. Notice the differences in shape associated with each projection. These differences are a direct result of the calculations used to flatten the data onto a 2-dimensional map.
There are lots of great resources that describe coordinate reference systems and projections in greater detail. For the purposes of this module, what is important to understand is that data from the same location but saved in different projections will not line up in any GIS or other program. Thus, it’s important when working with spatial data to identify the coordinate reference system applied to the data and retain it throughout data processing and analysis.
4.3 Components of a CRS
CRS information has three components:
Datum: A model of the shape of the earth. It has angular units (degrees) and defines the starting point (where is [0,0]?) so that the angles reference a meaningful spot on the earth. Common global datums are WGS84 and NAD83. Datums can also be local - fit to a particular area of the globe, but ill-fitting outside the area of intended use. In this module, we will use the WGS84 datum.
Projection: A mathematical transformation of the angular measurements on a round earth to a flat surface (i.e. paper or a computer screen). The units associated with a given projection are usually linear (feet, meters, etc.). In this module, we will see data in a few different projections.
Additional Parameters: Additional parameters are often necessary to create the full coordinate reference system. One common additional parameter is a definition of the center of the map. The number of required additional parameters depends on what is needed by each specific projection.
4.4 Orange peel analogy
A common analogy employed to teach projections is the orange peel analogy. If you imagine that the Earth is an orange, how you peel it and then flatten the peel is similar to how projections get made.
- A datum is the choice of fruit to use. Is the Earth an orange, a lemon, a lime, a grapefruit?
A projection is how you peel your orange and then flatten the peel.
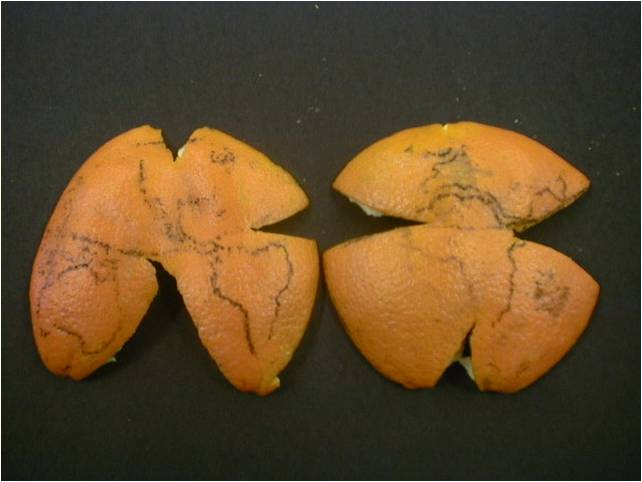
- An additional parameter could include a definition of the location of the stem of the fruit. What other parameters could be included in this analogy?
4.5 Which projection should I use?
To decide if a projection is right for your data, answer these questions:
- What is the area of minimal distortion?
- What aspect of the data does it preserve?
Peter Dana from the University of Colorado at Boulder and the Department of Geo-Information Processing have a good discussion of these aspects of projections. Online tools like Projection Wizard can also help you discover projections that might be a good fit for your data.
4.6 Describing coordinate reference systems
There are several common systems in use for storing and transmitting CRS information, as well as translating among different CRSs. These systems generally comply with ISO 19111. Common systems for describing CRSs include EPSG, OGC WKT, and PROJ strings.
4.6.1 EPSG
The EPSG system is a database of CRS information maintained by the International Association of Oil and Gas Producers. The dataset contains both CRS definitions and information on how to safely convert data from one CRS to another. Using EPSG is easy as every CRS has an integer identifier, e.g. WGS84 is EPSG:4326. The downside is that you can only use the CRSs defined by EPSG and cannot customise them (some datasets do not have EPSG codes). epsg.io is an excellent website for finding suitable projections by location or for finding information about a particular EPSG code.
4.6.2 Well-Known text (WKT)
The Open Geospatial Consortium WKT standard is used by a number of important geospatial apps and software libraries. WKT is a nested list of geodetic parameters. The structure of the information is defined on their website. WKT is valuable in that the CRS information is more transparent than in EPSG, but can be more difficult to read and compare than PROJ since it is meant to necessarily represent more complex CRS information. Additionally, the WKT standard is implemented inconsistently across various software platforms, and the spec itself has some known issues.
4.6.3 PROJ
PROJ is an open-source library for storing, representing and transforming CRS information. PROJ strings continue to be used, but the format is deprecated by the PROJ C maintainers due to inaccuracies when converting to the WKT format. The data and Python libraries we will be working with in this workshop use different underlying representations of CRSs under the hood for reprojecting. CRS information can still be represented with EPSG, WKT, or PROJ strings without consequence, but it is best to only use PROJ strings as a format for viewing CRS information, not for reprojecting data.
PROJ represents CRS information as a text string of key-value pairs, which makes it easy to read and interpret.
A PROJ4 string includes the following information:
- proj: the projection of the data
- zone: the zone of the data (this is specific to the UTM projection)
- datum: the datum used
- units: the units for the coordinates of the data
- ellps: the ellipsoid (how the earth’s roundness is calculated) for the data
Note that the zone is unique to the UTM projection. Not all CRSs will have a zone.

4.7 Format interoperability
Many existing file formats were invented by GIS software developers, often in a closed-source environment. This led to the large number of formats on offer today, and considerable problems transferring data between software environments. The Geospatial Data Abstraction Library (GDAL) is an open-source answer to this issue. In addition to there being multiple file formats, there are also many different projected coordinate reference systems in use and we often need to reproject data to make it consistent with the CRS of some other data set. PROJ is the answer to this problem.
4.7.1 GDAL
GDAL is an indispensable part of computational geospatial work. What is it?
- a translator library for raster and vector geospatial data formats (a few hundred) written in C, C++ and Python,
- an open source package (MIT License) released by The Open Source Geospatial Foundation (OSGeo),
- in addition to being used as a callable library, it includes a set of command line tools,
- is used as a core resource in countless GIS and geospatial analysis tools (e.g., free and open-source packages such as QGIS and GRASS; even ESRI appears to use GDAL to deal with custom raster formats).
GDAL is a set of software tools that translate between almost any geospatial format in common use today (and some not so common ones). GDAL also contains tools for editing and manipulating both raster and vector files, including reprojecting data to different CRSs. GDAL can be used as a standalone command-line tool, or built in to other GIS software. Several open-source GIS programs use GDAL for all file import/export operations.
Another related library, OGR, is part of the GDAL source code and focuses on “simple features vector data”. This GDAL FAQ page gives more detail on the GDAL/OGR relationship. When people say GDAL, it includes OGR. Speaking of saying, both “gee-doll” and “goo-dle” are used.
GDAL/OGR also relies on the PROJ library for projections and transformations.
Given the importance of GDAL and its use by so many geospatial software packages, it is somewhat surprising that for many years it was maintained by a single person. Check out this Mapscaping podcast on GDAL for a fascinating telling of the GDAL story.
We usually don’t have to install GDAL as it will get installed when we install higher level packages such as GeoPandas.
4.7.2 PROJ - transform geospatial coordinates between different coordinate reference systems
The PROJ library does the heavy lifting of translating between different CRS and projections. Much like GDAL, it is:
- open source,
- used both as a library and command line tool,
- foundational software to geospatial analysis,
- now maintained by OSGeo.
While the underlying library is C/C++, you can use PROJ from Python via the pyproj package. Like GDAL, pyproj will get installed when we install a higher level package such as GeoPandas.
4.8 Metadata
Spatial data is useless without metadata. Essential metadata includes the CRS information, but proper spatial metadata encompasses more than that. History and provenance of a dataset (how it was made), who is in charge of maintaining it, and appropriate (and inappropriate!) use cases should also be documented in metadata. This information should accompany a spatial dataset wherever it goes. In practice this can be difficult, as many spatial data formats don’t have a built-in place to hold this kind of information. Metadata often has to be stored in a companion file, and generated and maintained manually.
4.9 More Resources on CRS
- spatialreference.org - A comprehensive online library of CRS information.
- QGIS Documentation - CRS Overview.
- Choosing the Right Map Projection.
- Video highlighting how map projections can make continents seems proportionally larger or smaller than they actually are.
If you are going to work with geospatial data, you are going to have to learn about coordinate reference systems (CRS) and map projections. The world isn’t flat and it’s not a perfect sphere. However, most maps are flat. Projections are a way of translating our non-flat earth to a flat representation for mapping. The CRS is a specific type of “grid system” so that numeric X-Y coordinates can be associated with any point on the map.
- All geospatial datasets (raster and vector) are associated with a specific coordinate reference system.
- A coordinate reference system includes datum, projection, and additional parameters specific to the dataset.
A few interesting reference documents on CRS use by the USGS include:
4.10 Case Study: Land use analysis on the OU campus
For this this module, you’ll be working through a Jupyter notebook that introduces the very basics of working with coordinate reference systems.
4.10.1 Activities
Launch Jupyter lab and open the ou_land_use_03_crs.ipynb file. Work your way through out.